
Truck Accident Settlement Statistics (2026)
61 sourced 2023–2026 truck accident statistics: fatalities, injuries, fault, settlement & verdict sizes, and insurance claims — from NHTSA, IIHS, FMCSA & ATRI.
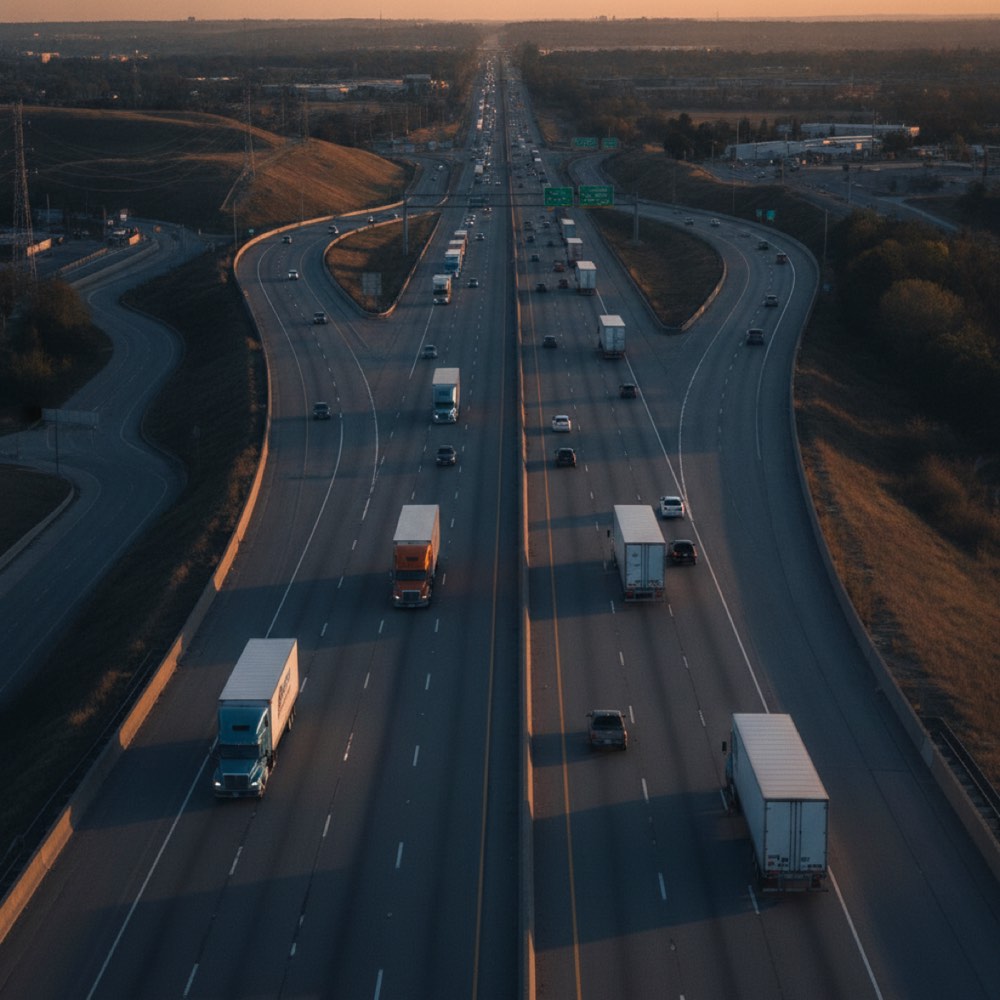
Truck accidents are among the most devastating and most expensive crashes on American roads. This page collects the most-cited 2023–2026 statistics on truck-crash frequency, injuries, causes, fault, settlement and verdict sizes, insurance claims, and how long cases take to resolve — each one sourced from a named primary authority such as NHTSA, the IIHS, the FMCSA, the Insurance Information Institute, the American Transportation Research Institute, and the Bureau of Justice Statistics. Figures are quoted as published; where two authorities count differently, both numbers are shown.
Want an estimate for your own case? Try our free truck accident settlement calculator — and for the formula behind these numbers, see how truck accident settlements are calculated and the average truck accident settlement guide.
Key Truck Accident Statistics
The headline numbers journalists and researchers cite most often, in one place.
- In 2023, 5,472 people were killed in traffic crashes involving large trucks — an 8% decrease from 5,969 in 2022. (Source: NHTSA Traffic Safety Facts, 2023 Data, 2025)
- An estimated 153,452 people were injured in large-truck crashes in 2023. (Source: NHTSA Traffic Safety Facts, 2023 Data, 2025)
- An estimated 528,177 large trucks were involved in police-reported crashes in 2023. (Source: NHTSA Traffic Safety Facts, 2023 Data, 2025)
- 70% of people killed in large-truck crashes were occupants of other vehicles, not the truck. (Source: NHTSA Traffic Safety Facts, 2023 Data, 2025)
- The average award in trucking cases over $1 million rose from $2.3 million in 2010 to $22.3 million in 2018 — a 967% increase. (Source: American Transportation Research Institute, 2020)
- Across 1,288 “nuclear verdicts” (awards over $10 million) from 2013 to 2022, the median was $21 million and the average was $89 million. (Source: U.S. Chamber Institute for Legal Reform, 2024)
- On a comprehensive-cost basis, a motor-vehicle fatality is valued at $11.3 million and the most serious injuries at $2–6 million each. (Source: NHTSA, Economic and Societal Impact of Motor Vehicle Crashes 2019, 2023)
- The average auto liability claim for bodily injury was $28,278 in 2024. (Source: Insurance Information Institute, 2024)
Truck Accident Frequency & Fatalities
How often large trucks crash, and how those crashes compare with the rest of the vehicle fleet. The number of people who died in large-truck crashes in 2023 was 38% higher than in 2009, the lowest year on record since fatal-crash data collection began in 1975 (Insurance Institute for Highway Safety, 2023).
- 5,375 large trucks were involved in fatal crashes and an estimated 114,552 in injury crashes in 2023. (Source: NHTSA Traffic Safety Facts, 2023 Data, 2025)
- Large trucks made up 9% of all vehicles in fatal crashes and 5% of vehicles in injury and property-damage crashes, while accounting for only 5% of registered vehicles. (Source: NHTSA Traffic Safety Facts, 2023 Data, 2025)
- 71% of large trucks in fatal crashes in 2023 were heavy trucks with a gross weight rating over 26,000 lb. (Source: NHTSA Traffic Safety Facts, 2023 Data, 2025)
- The involvement rate for large trucks in fatal crashes was 1.63 per 100 million large-truck miles traveled in 2023. (Source: NHTSA Traffic Safety Facts, 2023 Data, 2025)
- 80% of large trucks in fatal crashes were in multi-vehicle crashes, versus 63% for passenger vehicles. (Source: NHTSA Traffic Safety Facts, 2023 Data, 2025)
- 55% of fatal large-truck crashes occurred in rural areas and 25% on interstate highways in 2023. (Source: NHTSA Traffic Safety Facts, 2023 Data, 2025)
- 76% of fatal large-truck crashes occurred on weekdays (6 a.m. Monday to 5:59 p.m. Friday). (Source: NHTSA Traffic Safety Facts, 2023 Data, 2025)
- 47% of large-truck crash deaths occurred between 6 a.m. and 3 p.m., versus 28% of crash deaths not involving large trucks. (Source: Insurance Institute for Highway Safety, 2023)
- 73% of deaths in large-truck crashes involved tractor-trailers and 27% involved single-unit trucks in 2023. (Source: Insurance Institute for Highway Safety, 2023)
- Using FARS crash-involvement counts, the IIHS reports 4,354 people died in large-truck crashes in 2023 — a lower figure than NHTSA’s 5,472 because the two count crash involvement differently. (Source: Insurance Institute for Highway Safety, 2023)
Injury Severity & Types
Because of the size and weight disparity, the people most often killed or injured in a truck crash are in the other vehicle.
| Who is killed in large-truck crashes (2023) | Share | Number |
|---|---|---|
| Occupants of other vehicles | 70% | 3,837 |
| Truck occupants | 18% | 961 |
| Nonoccupants (pedestrians, cyclists) | 12% | 674 |
Source: NHTSA Traffic Safety Facts, 2023 Data.
- Of the people injured in large-truck crashes in 2023, 70% (107,636) were occupants of other vehicles, 27% (41,733) were truck occupants, and 3% (4,083) were nonoccupants. (Source: NHTSA Traffic Safety Facts, 2023 Data, 2025)
- Large trucks often weigh 20–30 times as much as passenger cars and ride higher off the ground, which can cause smaller vehicles to underride the truck in a crash. (Source: Insurance Institute for Highway Safety, 2023)
- Loaded tractor-trailers need 20%–40% more distance than cars to stop, and even more on wet roads or with poorly maintained brakes. (Source: Insurance Institute for Highway Safety, 2023)
- 49% of large-truck occupant deaths in 2023 happened in crashes in which the truck rolled over, far higher than the 21% rollover share for car-occupant deaths. (Source: Insurance Institute for Highway Safety, 2023)
- In two-vehicle fatal crashes involving a large truck, the truck was struck in the rear more than three times as often as the other vehicle (21.2% versus 6.3%). (Source: NHTSA Traffic Safety Facts, 2023 Data, 2025)
Causes & Contributing Factors
What the federal crash-causation research actually found about why large trucks crash. (The FMCSA Large Truck Crash Causation Study remains the definitive federal study; its data was collected 2001–2003 and published in 2006.)
- When a large truck was assigned the critical reason for a crash, driver error accounted for 87% of those reasons; vehicle and environmental factors made up the rest. (Source: FMCSA Large Truck Crash Causation Study, 2006)
- Among critical reasons assigned to truck drivers, decision errors (e.g., driving too fast, following too closely) accounted for 38% and recognition errors (e.g., inattention, distraction) for 28% — together two-thirds of the total. (Source: FMCSA Large Truck Crash Causation Study, 2006)
- Brake problems were coded for nearly 30% of the trucks in large-truck crashes, but only 5% of the passenger vehicles. (Source: FMCSA Large Truck Crash Causation Study, 2006)
- Only 6% of large-truck drivers in fatal crashes were speeding in 2022, compared with 35% of motorcyclists, 22% of passenger-car drivers, and 15% of light-truck drivers. (Source: NHTSA Traffic Safety Facts, 2022 Data: Speeding, 2024)
- Only 3% of large-truck drivers in fatal crashes in 2022 had a blood-alcohol concentration of .08 g/dL or higher, versus 28% for motorcyclists, 25% for passenger-car drivers, and 21% for light-truck drivers. (Source: NHTSA Traffic Safety Facts, 2022 Data: Large Trucks, 2024)
- 20.8% of large-truck drivers in fatal crashes in 2022 had a previously recorded crash — the highest share of any vehicle type. (Source: NHTSA Traffic Safety Facts, 2022 Data: Large Trucks, 2024)
- A large-scale naturalistic driving study found driver drowsiness in 8.8%–9.5% of all crashes and 10.6%–10.8% of crashes serious enough to be police-reported. (Source: AAA Foundation for Traffic Safety, 2018)
Liability & Fault
Fault is split more evenly than many assume — but the consequences are not. In two-vehicle crashes between a passenger vehicle and a large truck in 2023, 97% of the vehicle occupants killed were in the passenger vehicle (2,190 deaths versus 60 truck-occupant deaths) (Insurance Institute for Highway Safety, 2023).
- In two-vehicle crashes between a passenger vehicle and a large truck, the critical reason was assigned to the passenger vehicle in 56% of crashes and to the large truck in 44%. (Source: FMCSA Large Truck Crash Causation Study, 2006)
- The FMCSA causation study examined 967 crashes involving 1,127 large trucks and 959 other vehicles, weighted to represent about 141,000 large trucks in fatal and injury crashes. (Source: FMCSA Large Truck Crash Causation Study, 2006)
- 70% of people killed in large-truck crashes in 2022 were occupants of other vehicles, consistent with 2023. (Source: NHTSA Traffic Safety Facts, 2022 Data: Large Trucks, 2024)
Settlement & Verdict Sizes
There is no single “average” truck-accident settlement — most cases settle privately and amounts swing widely with injury severity. These authoritative reference points show the range, and why the top end has exploded. The average size of trucking verdicts over $1 million grew 51.7% per year from 2010 to 2018, versus 1.7% for standard inflation and 2.9% for healthcare costs (American Transportation Research Institute, 2020).
- The mean trucking verdict across all cases the ATRI studied from 2006 to 2019 was $3.16 million. (Source: American Transportation Research Institute, 2020)
- In the ATRI dataset of roughly 600 trucking cases, only 26 cases exceeded $1 million in 2006–2011, versus nearly 300 such cases in 2014–2019. (Source: American Transportation Research Institute, 2020)
- Across 1,288 nuclear verdicts (over $10 million) from 2013 to 2022, the median was $21 million and the average was $89 million. (Source: U.S. Chamber Institute for Legal Reform, 2024)
- There were at least 23 verdicts over $100 million in 2023 — an all-time high — with a preliminary median nuclear verdict near $23.8 million. (Source: U.S. Chamber Institute for Legal Reform, 2023)
- On a comprehensive-cost basis, a motor-vehicle fatality is valued at $11.3 million and the most serious nonfatal injuries (MAIS 4–5) at $2–6 million each — a useful proxy for the human cost juries weigh. (Source: NHTSA, Economic and Societal Impact of Motor Vehicle Crashes 2019, 2023)
Distribution of “nuclear verdicts” by size, 2013–2022:
| Verdict size | Share of nuclear verdicts |
|---|---|
| $10–20 million | ~48% |
| $20–50 million | ~33% |
| Over $50 million | 19% |
Source: U.S. Chamber Institute for Legal Reform, 2024.
Insurance & Claims
What everyday auto claims look like, and why commercial trucking premiums are climbing so fast.
| Average U.S. auto insurance claim by type (2024) | Average amount |
|---|---|
| Bodily injury liability | $28,278 |
| Property damage liability | $6,770 |
| Collision | $5,489 |
| Comprehensive | $2,306 |
Source: Insurance Information Institute, 2024.
- Commercial auto claim severity rose 78% from 2014 to 2023, compared with a 29% rise in the Consumer Price Index over the same period. (Source: Triple-I / Casualty Actuarial Society, 2024)
- Rising inflation drove commercial-auto liability losses and defense costs up by $118.9 billion to $137.2 billion between 2014 and 2023. (Source: Triple-I / Casualty Actuarial Society, 2024)
- An estimated $21 billion of auto-liability cost inflation from 2014 to 2019 is attributable to “social inflation” — excess claim costs tied to litigation. (Source: Triple-I / Casualty Actuarial Society, 2024)
- Commercial truck insurance premiums increased between 35% and 40% per year for low- to average-risk carriers. (Source: American Trucking Associations, citing ATRI, 2020)
Economic Cost of Crashes
The societal price tag of motor-vehicle crashes, and the per-outcome cost figures that underpin most injury valuations. Motor-vehicle crashes cost American society $340 billion in economic costs in 2019 — and nearly $1.4 trillion once quality-of-life valuations are included (NHTSA, Economic and Societal Impact of Motor Vehicle Crashes 2019, 2023).
- The $340 billion in 2019 crash costs equals $1,035 for every person in the U.S. and 1.6% of real GDP that year. (Source: NHTSA, Economic and Societal Impact of Motor Vehicle Crashes 2019, 2023)
- The 2019 total was about 40% higher than NHTSA’s prior estimate of $242 billion for 2010. (Source: NHTSA, Economic and Societal Impact of Motor Vehicle Crashes 2019, 2023)
- Each crash fatality carried an average economic cost of $1.6 million, rising to $11.3 million on a comprehensive basis. (Source: NHTSA, Economic and Societal Impact of Motor Vehicle Crashes 2019, 2023)
| Crash outcome (2023) | Avg economic cost | Avg comprehensive cost |
|---|---|---|
| Death | $1,952,000 | $13,705,000 |
| Nonfatal disabling injury | $167,000 | $1,112,000 |
| Evident injury | $44,000 | — |
| Property damage (per vehicle) | $6,300 | — |
Source: National Safety Council, Injury Facts, 2023.
Litigation & Legal Process
How injury cases actually move through the courts. (The Bureau of Justice Statistics tort-trial surveys remain the definitive federal dataset; the figures below are from its 2005 study.)
- Only about 4% of tort cases are disposed of by trial — the overwhelming majority settle or resolve without a verdict. (Source: Bureau of Justice Statistics, Tort Trials in State Courts, 2005)
- Plaintiffs prevailed in roughly half of tort trials: 56% of bench trials and 51% of jury trials. In automobile-accident cases specifically, plaintiffs won 64% of the time. (Source: Bureau of Justice Statistics, Tort Trials in State Courts, 2005)
- The median final award was $24,000 across all tort trials, and $15,000 in motor-vehicle accident cases, with 40% of winning plaintiffs awarded $10,000 or less. (Source: Bureau of Justice Statistics, Tort Trials in State Courts, 2005)
- The median time from filing to final verdict was 23 months for jury trials and 18 months for bench trials. (Source: Bureau of Justice Statistics, Tort Trials in State Courts, 2005)
- Motor-vehicle accident cases were the single most common civil trial type — 35% of all civil trials and nearly 60% of tort trials. (Source: Bureau of Justice Statistics, Civil Trials in State Courts, 2005)
- The number of general civil cases decided by trial in the 75 largest counties fell about 50% from 1992 to 2005, reflecting a long-term shift toward settlement. (Source: Bureau of Justice Statistics, Civil Trials in State Courts, 2005)
Frequently Asked Questions
How many people are killed in truck accidents in the U.S. each year?
In 2023 there were 5,472 people killed in traffic crashes involving large trucks, an 8% decrease from 5,969 in 2022 (NHTSA). An estimated 153,452 people were injured. About 70% of those killed were occupants of other vehicles, not the truck.
What is the average truck accident settlement worth?
There is no single reliable “average,” because most cases settle privately and amounts vary enormously with injury severity. For context: the ATRI found the mean trucking verdict from 2006 to 2019 was $3.16 million, and the average award in trucking cases over $1 million grew from $2.3 million in 2010 to $22.3 million in 2018. NHTSA values a fatality at $11.3 million and the most serious injuries at $2–6 million on a comprehensive basis. The average auto bodily-injury liability claim was $28,278 in 2024.
Who is usually at fault in a truck accident?
It varies. In the FMCSA causation study of two-vehicle truck-and-car crashes, the critical reason was assigned to the passenger vehicle in 56% of crashes and to the truck in 44%. But because of the size disparity, occupants of the smaller vehicle bear most of the harm: in 2023, 97% of people killed in two-vehicle truck-versus-car crashes were in the passenger vehicle (IIHS).
How long does a truck accident lawsuit take?
Most cases settle without a trial — only about 4% of tort cases are disposed of by trial (Bureau of Justice Statistics). For those that do go to trial, the median time from filing to verdict was 23 months for jury trials and 18 months for bench trials.
What is a “nuclear verdict” in trucking?
A nuclear verdict is a jury award over $10 million. Across 1,288 nuclear verdicts from 2013 to 2022, the median was $21 million and the average was $89 million (U.S. Chamber Institute for Legal Reform). In 2023 there were at least 23 verdicts over $100 million, an all-time high.
Why are truck accident settlements and insurance costs rising?
Litigation-driven “social inflation” is a major factor. Commercial auto claim severity rose 78% from 2014 to 2023 while the CPI rose 29%, and an estimated $21 billion of auto-liability cost inflation from 2014 to 2019 was tied to social inflation (Triple-I/CAS). Commercial truck premiums have risen 35–40% per year for many carriers.
Sources
Every statistic above is drawn from one of the following organizations or publications: NHTSA (National Highway Traffic Safety Administration) — Traffic Safety Facts and the Economic and Societal Impact of Motor Vehicle Crashes (2019); the Insurance Institute for Highway Safety (IIHS); the FMCSA Large Truck Crash Causation Study; the Insurance Information Institute (Triple-I) and Triple-I / Casualty Actuarial Society; the American Transportation Research Institute (ATRI) and the American Trucking Associations; the U.S. Chamber Institute for Legal Reform; the National Safety Council (Injury Facts); the Bureau of Justice Statistics; and the AAA Foundation for Traffic Safety.